NVDA technical workup: data through the Oct 7, 2026 close
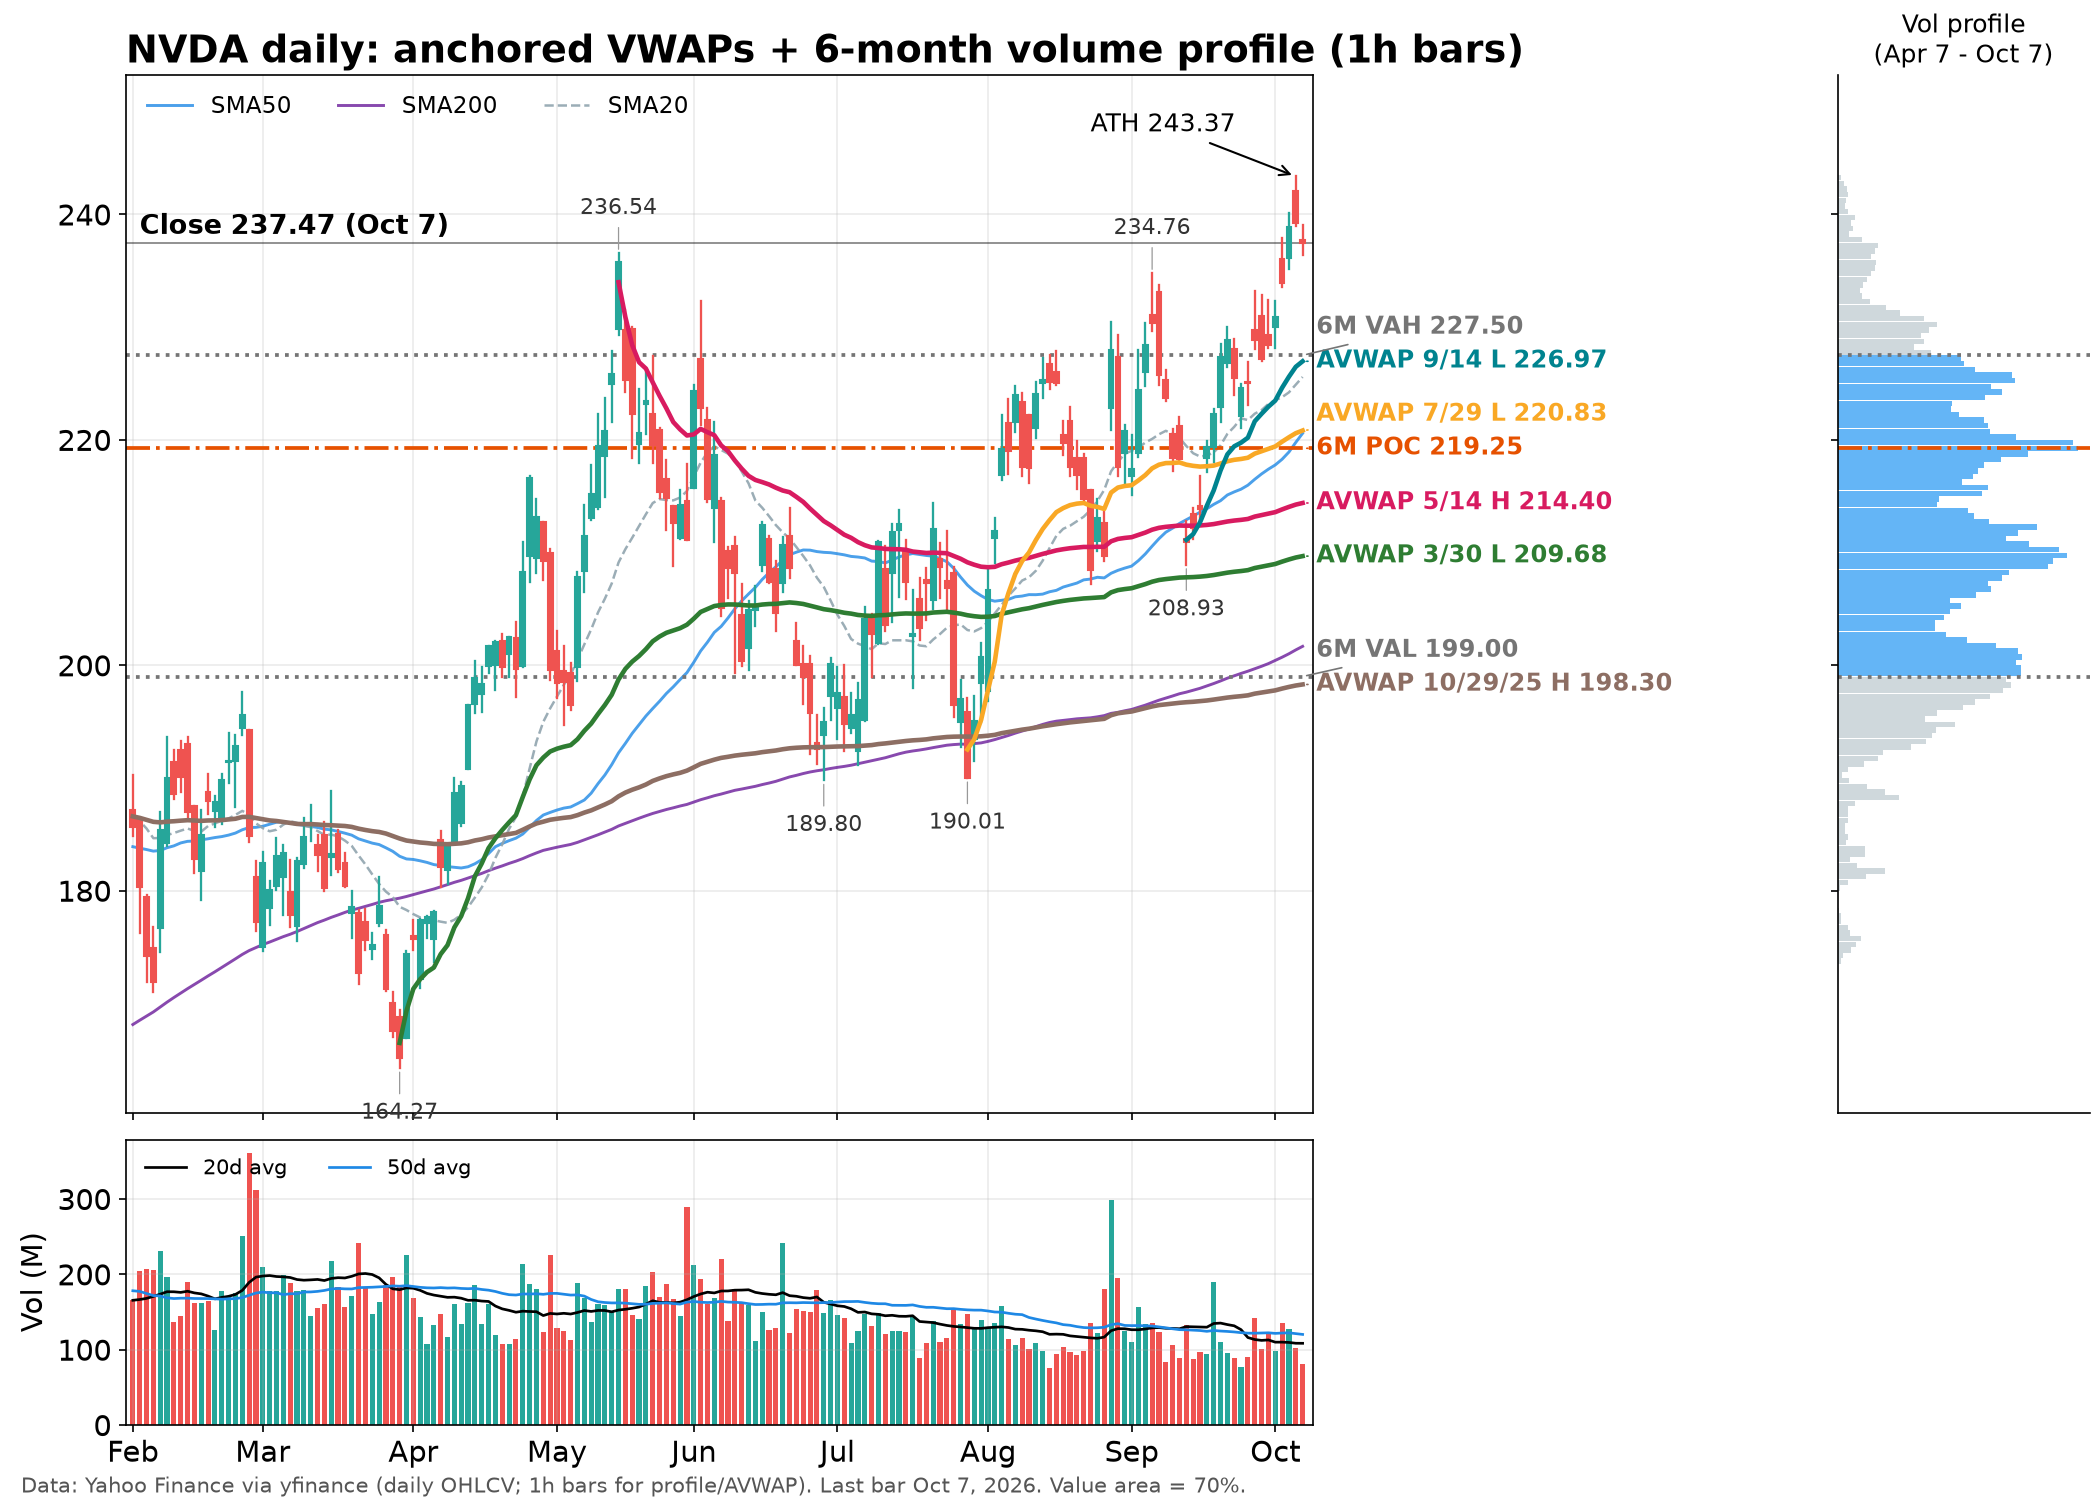
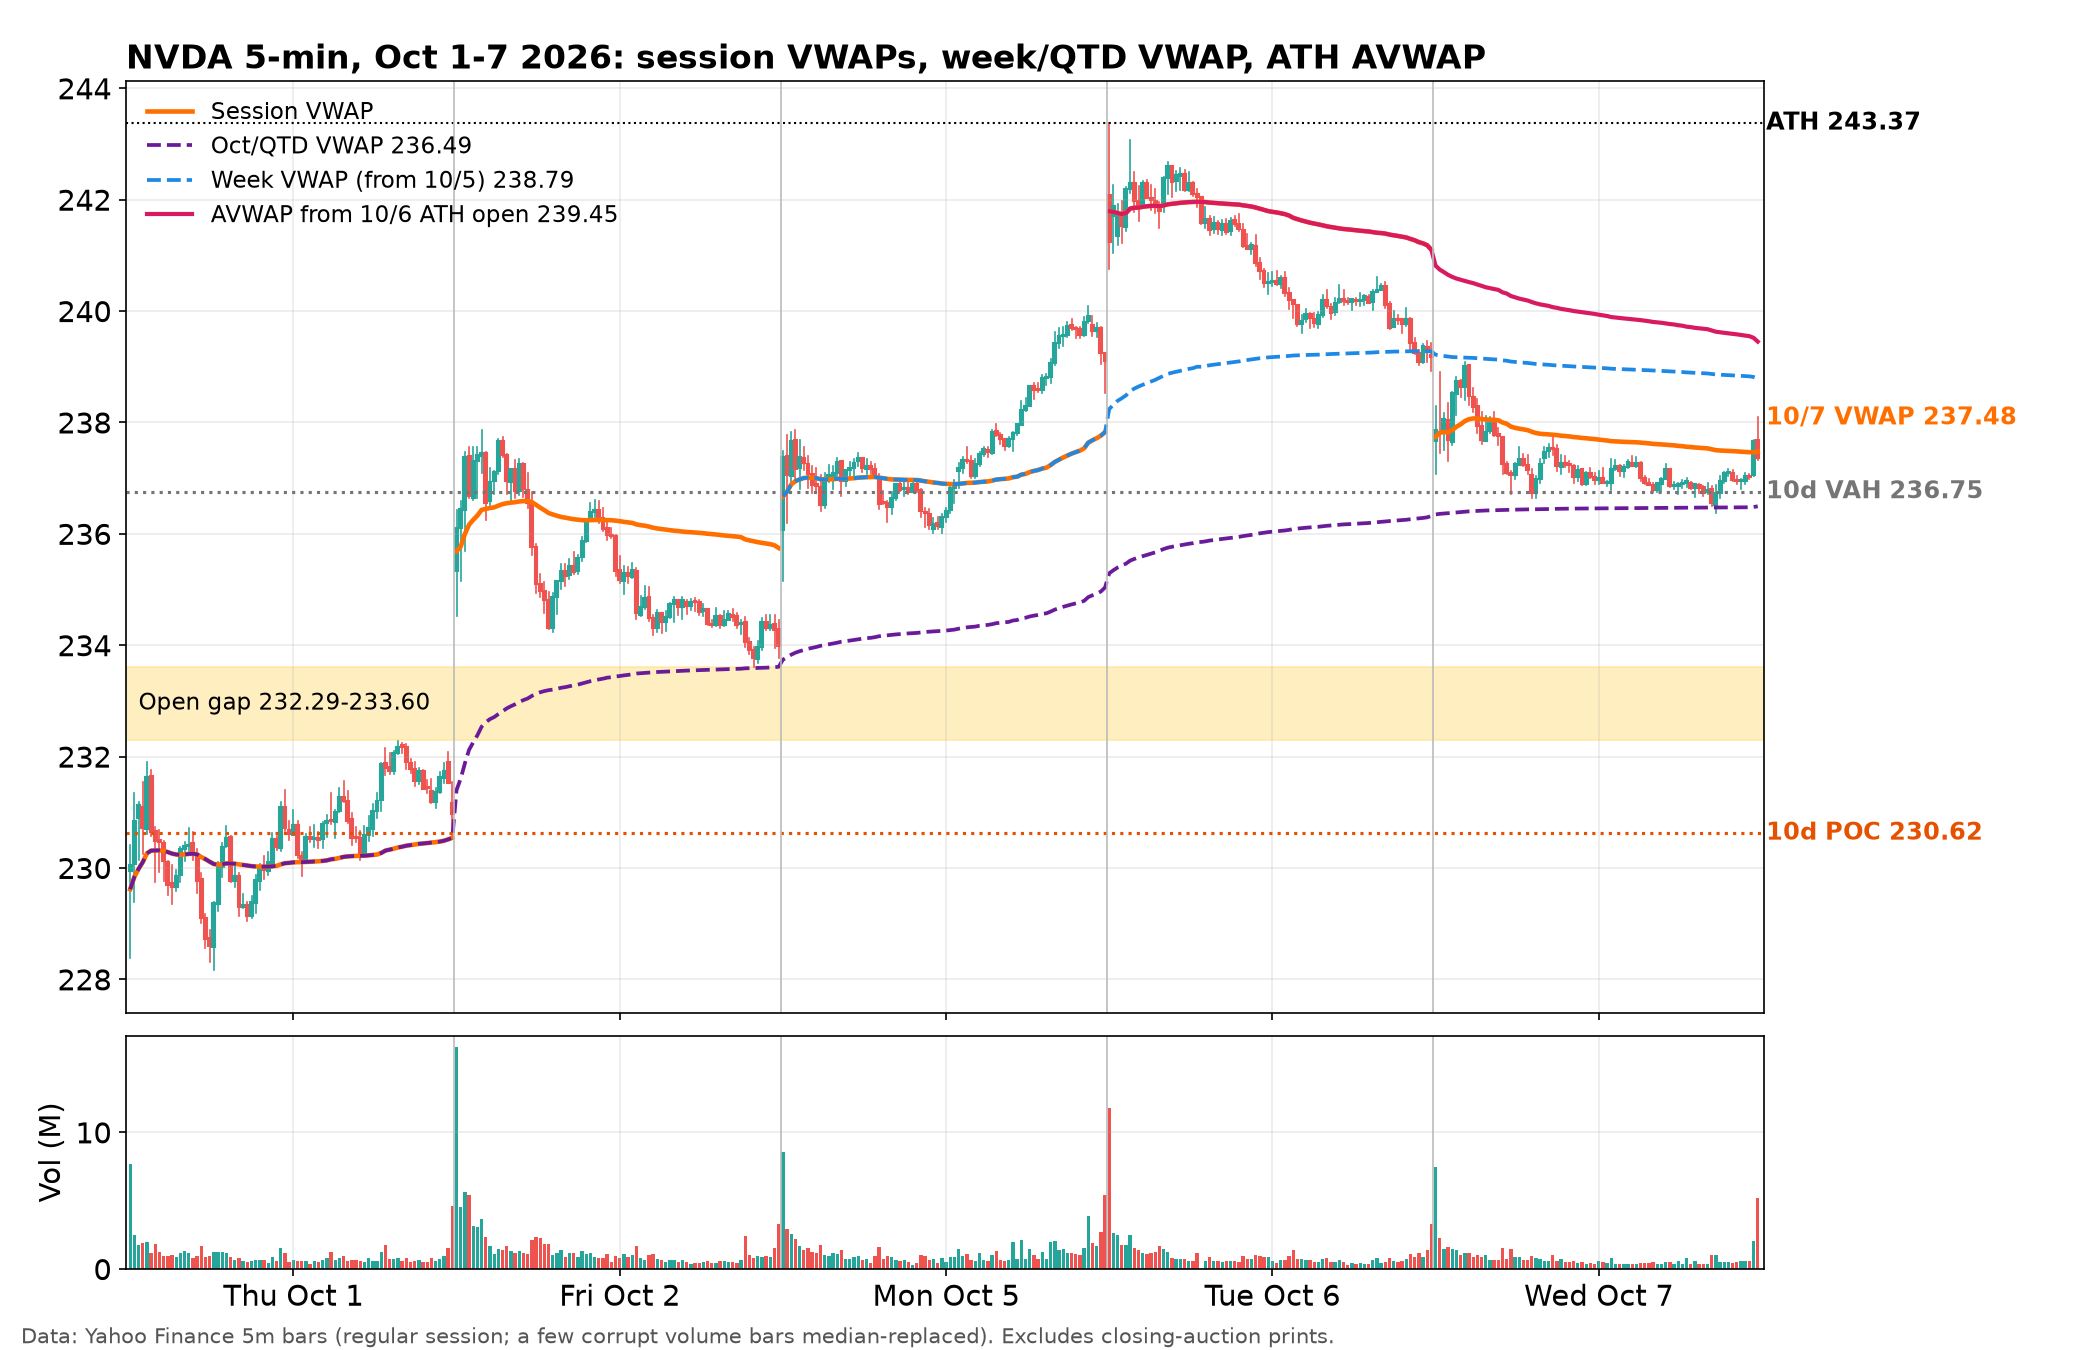
Files: nvda_chart.png (daily + AVWAP + 6M profile), nvda_intraday.png (5m Oct 1-7 + VWAPs), analysis_output.txt (full numeric dump), results.json, earnings_reactions.csv, profile_*.csv, daily_enriched.csv. Scripts: fetch.py, clean.py, analyze.py, chart.py, chart_intraday.py (re-run in order with .venv activated). Data: Yahoo Finance via yfinance 1.7.0 (unadjusted OHLC; dividends are immaterial). Last close cross-checked against Yahoo chart API: 237.47. Revenue consensus figures: LSEG via CNBC/Reuters. EPS estimates: yfinance earnings_dates. Intraday caveat: Yahoo 1m/5m/15m feeds had corrupt volume spikes; bars >6x their local median were replaced with the median (70 of 1949 1m bars, 9 of 780 5m, 38 of 1560 15m, 2 of 5073 1h). After that fix, intraday sums run about 80% of daily volume because closing-auction prints are excluded.