


Someone I respect recently argued that political gridlock is good for stocks. The idea is that when one party doesn't hold the White House, the Senate and the House, less gets passed, markets get more certainty and growth keeps going. It's a common view and it sounds reasonable. So I tested it.
Everything below uses the S&P 500 price index from 1947 to 2025, so no dividends. Data runs through October 30, 2026.
Gridlock on its own
I sorted every two-year Congress since 1947 into unified (one party holds the presidency and both chambers) or divided (any other mix). That gives 15 unified and 24 divided complete Congresses.
The medians favor unified government. Median annualized return was 13.0% under unified control and 8.4% under divided control. The means are closer, 9.4% against 8.2%, and a Welch test on that gap gives p = 0.73. That's what noise looks like. Start the clock in 1977 and the medians flip to 7.0% unified and 8.4% divided, with p = 0.63.
If gridlock brings certainty, it should show up around elections. It mostly doesn't. In the 12 months after each of the 19 midterms from 1950 to 2022, the median gain was +14.9% when the vote produced unified government and +13.6% when it produced divided government (p = 0.98). Both are strong. Keep that in mind.
The VIX only goes back to 1990, so the volatility test is short. One month after the vote, the median VIX change was -4.64 points after unified outcomes and +0.10 points after divided ones. That's the opposite of a certainty premium. But six of the seven unified outcomes came out of presidential elections, and the VIX has tended to fall once a White House race is settled.
Drawdowns point the same way. The worst peak-to-trough drop inside a unified Congress was -28.0%. Inside a divided Congress it was -51.9%, during 2007 to 2009.
Last, I regressed each Congress's annualized return on a divided-government flag, the starting Shiller CAPE and a recession flag, across 39 complete Congresses. Divided government added +0.6 points a year with p = 0.87. Each extra point of starting CAPE took about 0.5 points a year off the return, and a recession during the Congress took off about 7.9 points. Both of those had p values near 0.05. The model explains about 15% of the variation, so most of the story sits outside it. Valuation and the business cycle still carry far more weight than who controls Washington.
My read is that history doesn't support gridlock itself as the driver. Markets have usually done fine under both setups.
Election years vs everything else
Next I compared years by type. Each year starts from the close the day before Election Day in early November. Odd years use the same early-November date. Twelve months later:
- Presidential election years: up 65% of the time, median +8.3% (20 cases)
- Midterm years: up 100% of the time, median +15.1% (19 cases)
- Odd years: up 77% of the time, median +8.5% (39 cases)
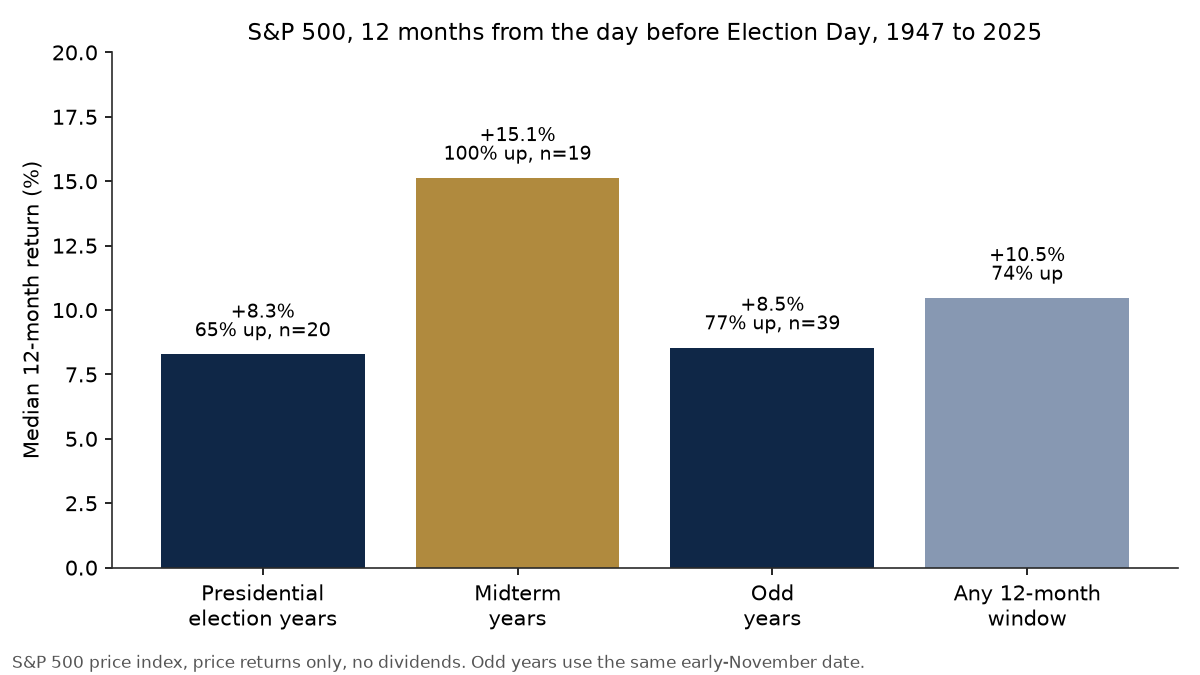
For context, any 12-month window since 1947, starting on any trading day, was up 74% of the time with a median of +10.5%. "Stocks usually rise in the year after an election" sounds like a signal. Stocks usually rise in the year after almost anything. The coin is weighted toward up before any election enters the picture.
Against that baseline, presidential years look ordinary. Against odd years, the 12-month p values run from 0.37 to 0.85 across the tests I ran. The edge belongs to midterms. All 19 six-month windows were up as well, with a median of +15.6%. Midterm years beat odd years at six months with p < 0.001 on the return tests, and at 12 months with p between 0.008 and 0.035 depending on the test.
The presidential cycle
Yale Hirsch popularized the presidential election cycle theory through the Stock Trader's Almanac. The idea is that stocks follow the four-year term, softer in the first half and stronger in the year before the next presidential election.
The usual explanation is incentives. Year 3 is the last full year an administration has to make its case to voters before the next presidential election, so the pressure is on to keep the economy strong. Tough or unpopular policy tends to land early in a term, and the push for growth comes later. To me that matters more than anything about the midterm vote itself. The data shows when the strength arrives, but it can't prove why. Other explanations exist too, like the timing of Fed policy, or a weak midterm year leaving room to bounce.
Calendar-year returns, 1949 to 2025:
| Year of term | % up | Median | Mean |
|---|---|---|---|
| 1, post-inauguration | 65% | +9.8% | +8.5% |
| 2, midterm | 58% | +1.1% | +4.6% |
| 3, pre-election | 89% | +18.9% | +17.2% |
| 4, election | 84% | +11.8% | +8.1% |
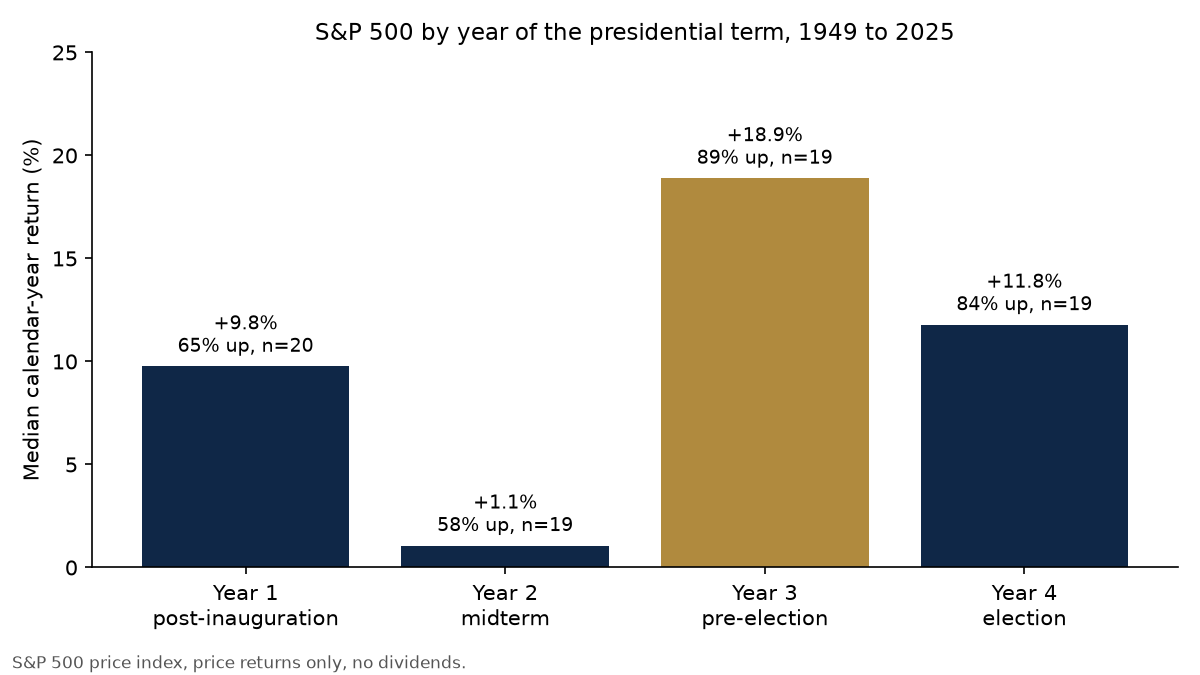
Year 3 stands out. Its worst year in the sample was -0.7%. Against years 1, 2 and 4 pooled, the return tests give p between 0.004 and 0.02. A test on the share of up years alone is weaker (p = 0.13).
Two things cut against it. Year 3 was the single best year of its term only 6 times in 19. And the edge has faded. From 1986 to 2025, year 3 averaged +16.4% and year 1 averaged +17.1%, and the year-3 gap falls out of significance (p = 0.15).
There's also a popular version that measures from the midterm-year low. From the lowest close of each midterm year to the close of the following year, the S&P 500 was up 19 times out of 19, with a median gain of +41%. That one only works in hindsight. Nobody knows the low while it's happening.
The post-midterm effect and the year-3 effect are the same thing. A 12-month window that starts in early November of a midterm year is mostly year 3. It's also why both gridlock outcomes looked strong after midterms. The calendar did the work.
That doesn't make the midterm meaningless. It decides who controls Congress for the next two years, and that shapes policy. It just didn't change the returns in this data.
Where that leaves 2026
The midterm is November 3, and 2027 is year three of President Trump's current term. On the calendar, this is the stretch history has liked best.
I'd hold that loosely. Each of these groups has about 20 cases. The year-3 edge has weakened over the last four decades. And starting valuation, which the regression weighted more than party control, is high. The Shiller CAPE was 37.1 when this Congress began in January 2025 and 40.7 as of October 2026. The median complete Congress since 1947 started at 18.7.
The highest CAPE at any midterm in this sample was 37.4, in November 1998. October's reading is already above it.
Sources
- S&P 500 index (^GSPC) daily closes, 1946 to Oct 30, 2026: Yahoo Finance
- CBOE Volatility Index (^VIX) daily closes, 1990 to Oct 30, 2026: Yahoo Finance
- Shiller CAPE, monthly through October 2026: Robert Shiller, U.S. stock market data
- NBER-based recession indicator, monthly: FRED, Federal Reserve Bank of St. Louis
- Party control of the presidency, Senate and House by Congress, 1947 to 2026: Wikipedia, Divided government in the United States
Sources
- Wikimedia Commonscommons.wikimedia.org/wiki/File:Vote_Here_-_Election_Polling_Pl…
- creativecommons.orgcreativecommons.org/licenses/by/2.0
- Yahoo Financefinance.yahoo.com/quote/%5EGSPC/history
- Yahoo Financefinance.yahoo.com/quote/%5EVIX/history
- shillerdata.comshillerdata.com
- FREDfred.stlouisfed.org/series/USREC
- en.wikipedia.orgen.wikipedia.org/wiki/Divided_government_in_the_United_States